How to Use Grow Zones
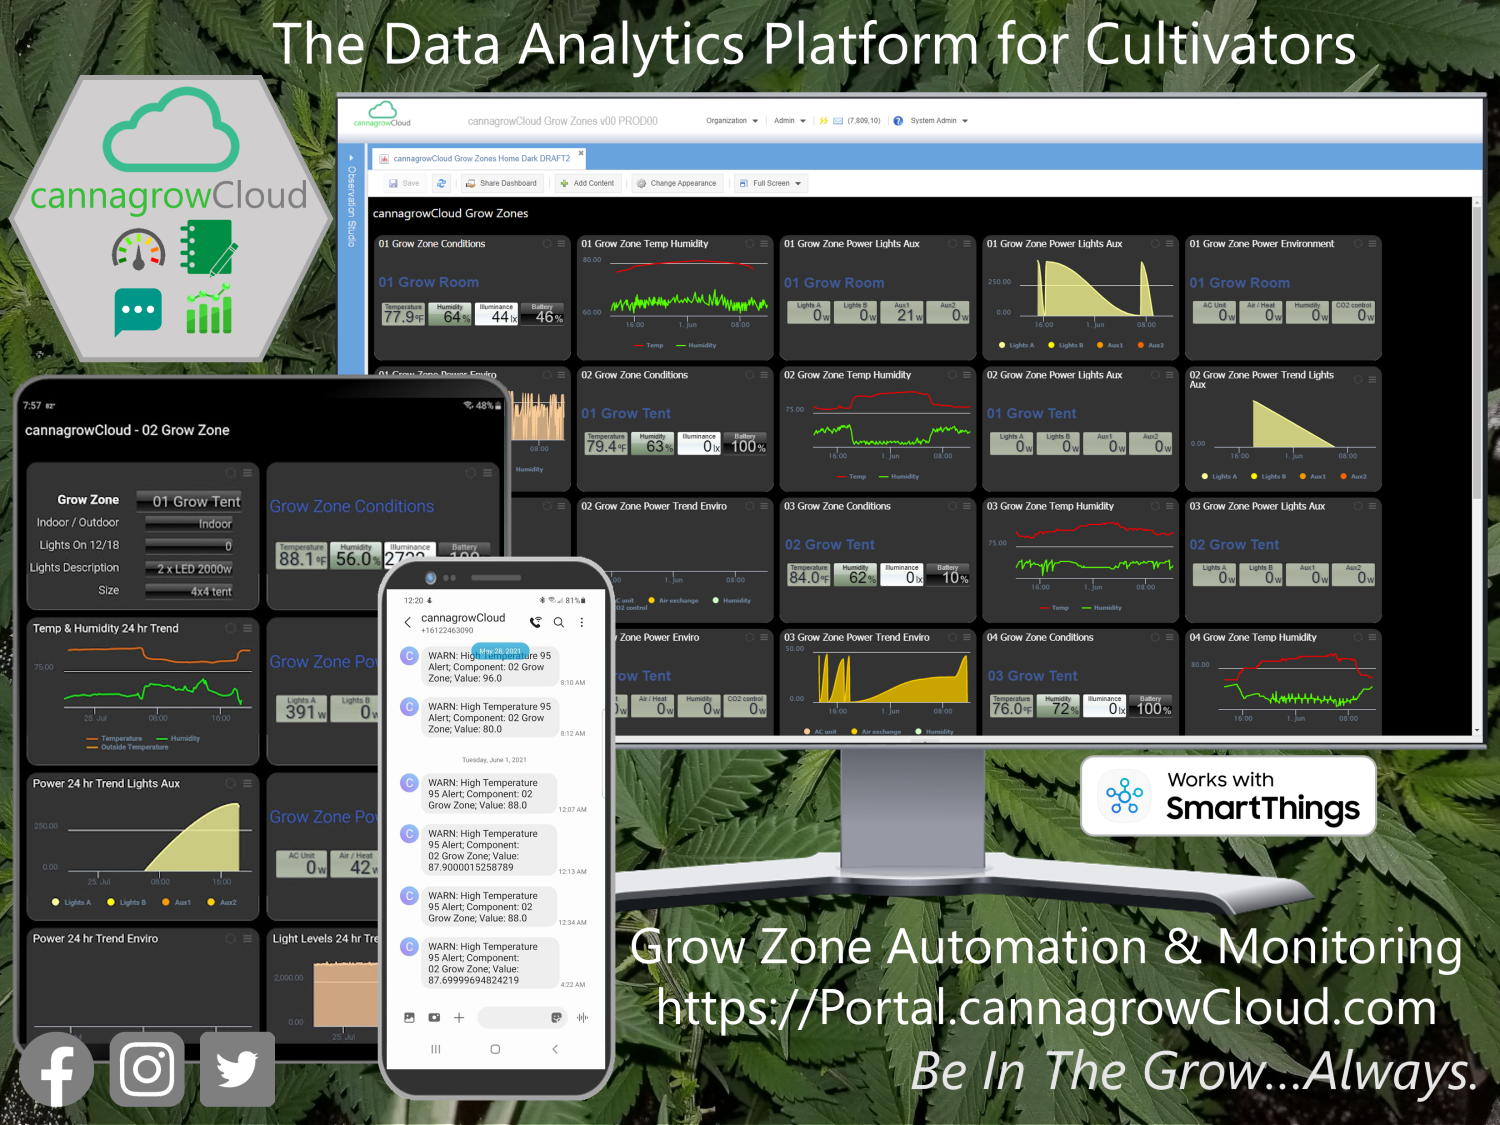
Using Grow Zones
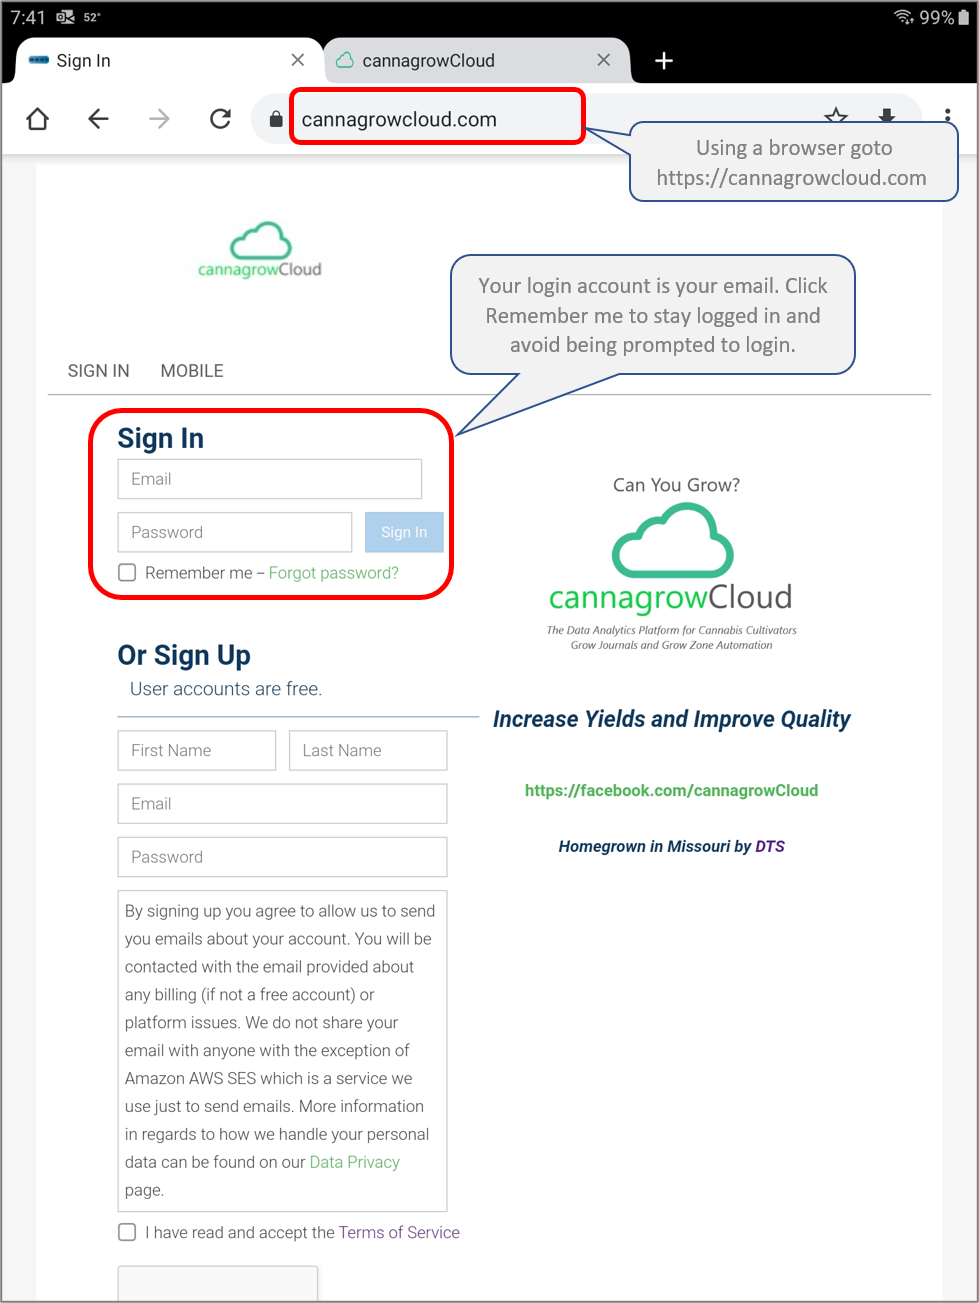
Use a browser on any device (phone / tablet / PC) and go to https://cannagrowcloud.com to login and use Grow Zones.
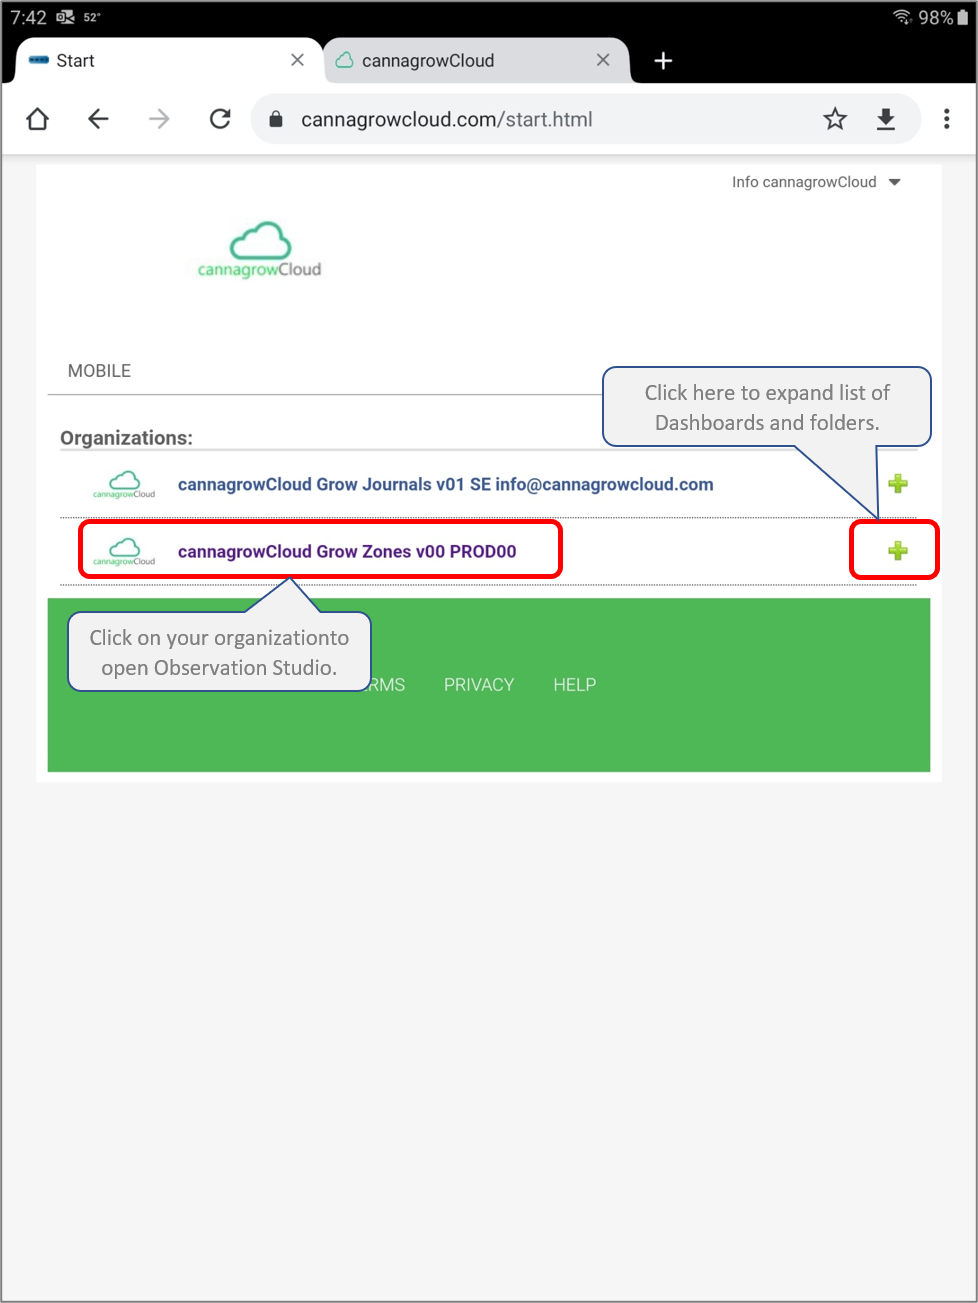
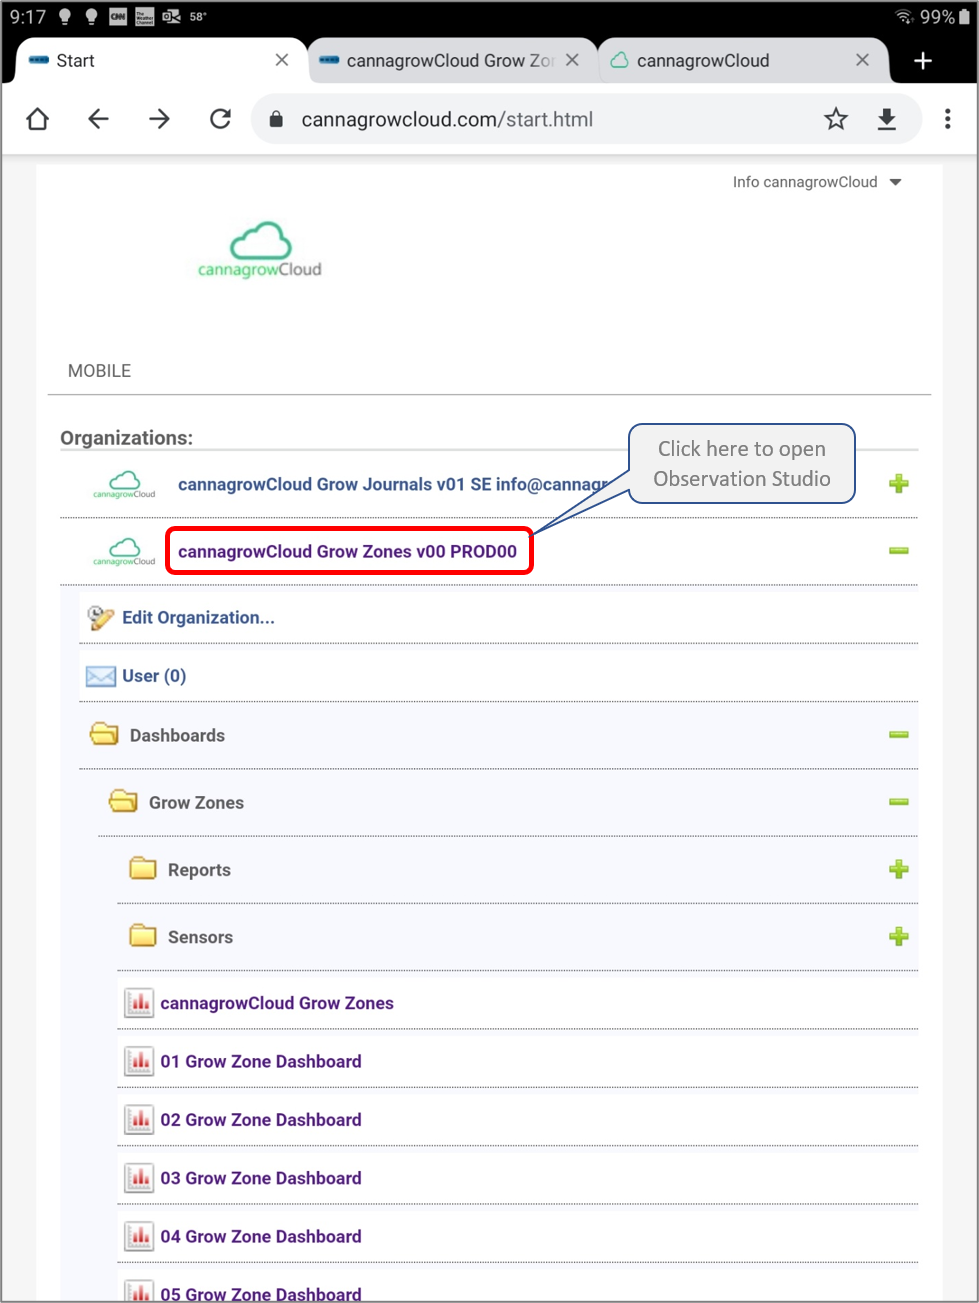
After login you'll goto a start page with your cannagrowCloud organization and links to Dashboards and Observation Studio. Click on '+' to show a list of dashboards and folders. Click on your organization's name to open Observation Studio.
Expanding the menus will provide you links to Grow Zone Dashboards and folders for Sensors and Reports.
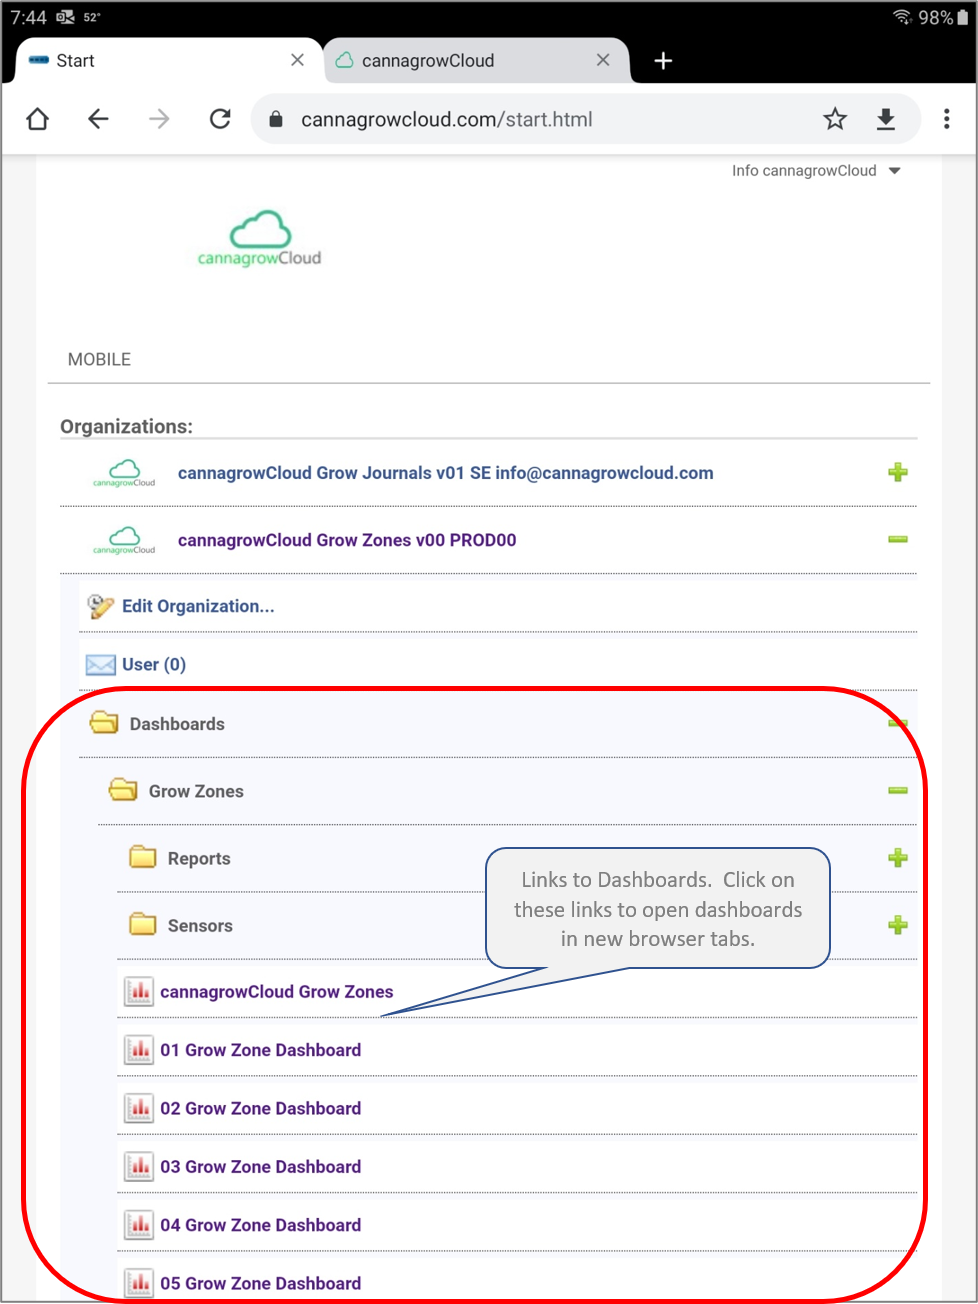
Click on cannagrowCloud Grow Zones to open the overview dashboard that shows current conditions and power usage for each Grow Zone and provides links to Grow Zone Dashboards.
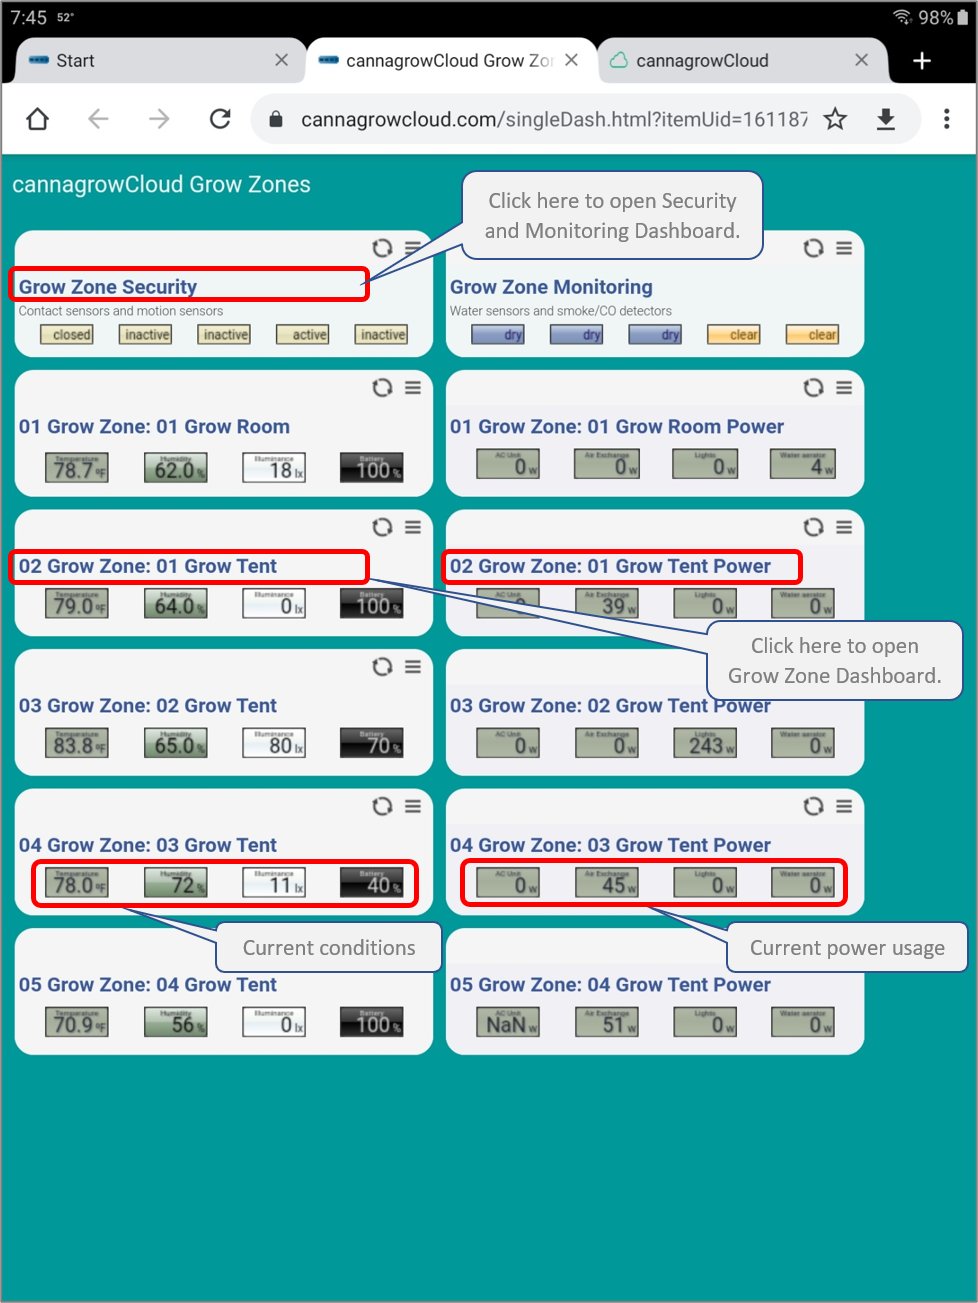
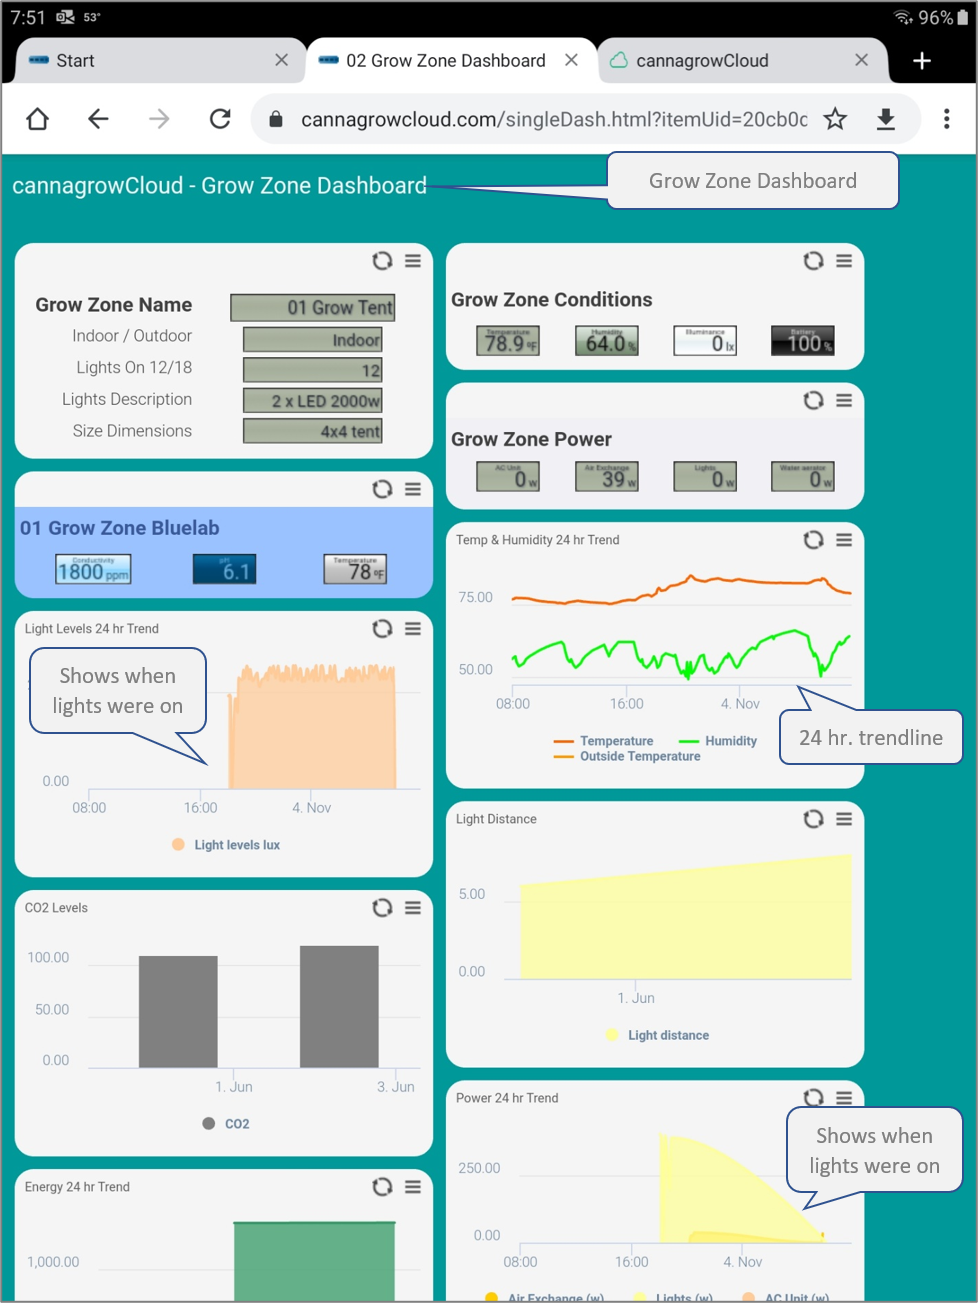
Grow Zone Dashboards provide current conditions, power usage, and 24 hour trendlines for temperature, humidity, light levels, and power usage. Review the 24 hour trends to see when devices are operating.
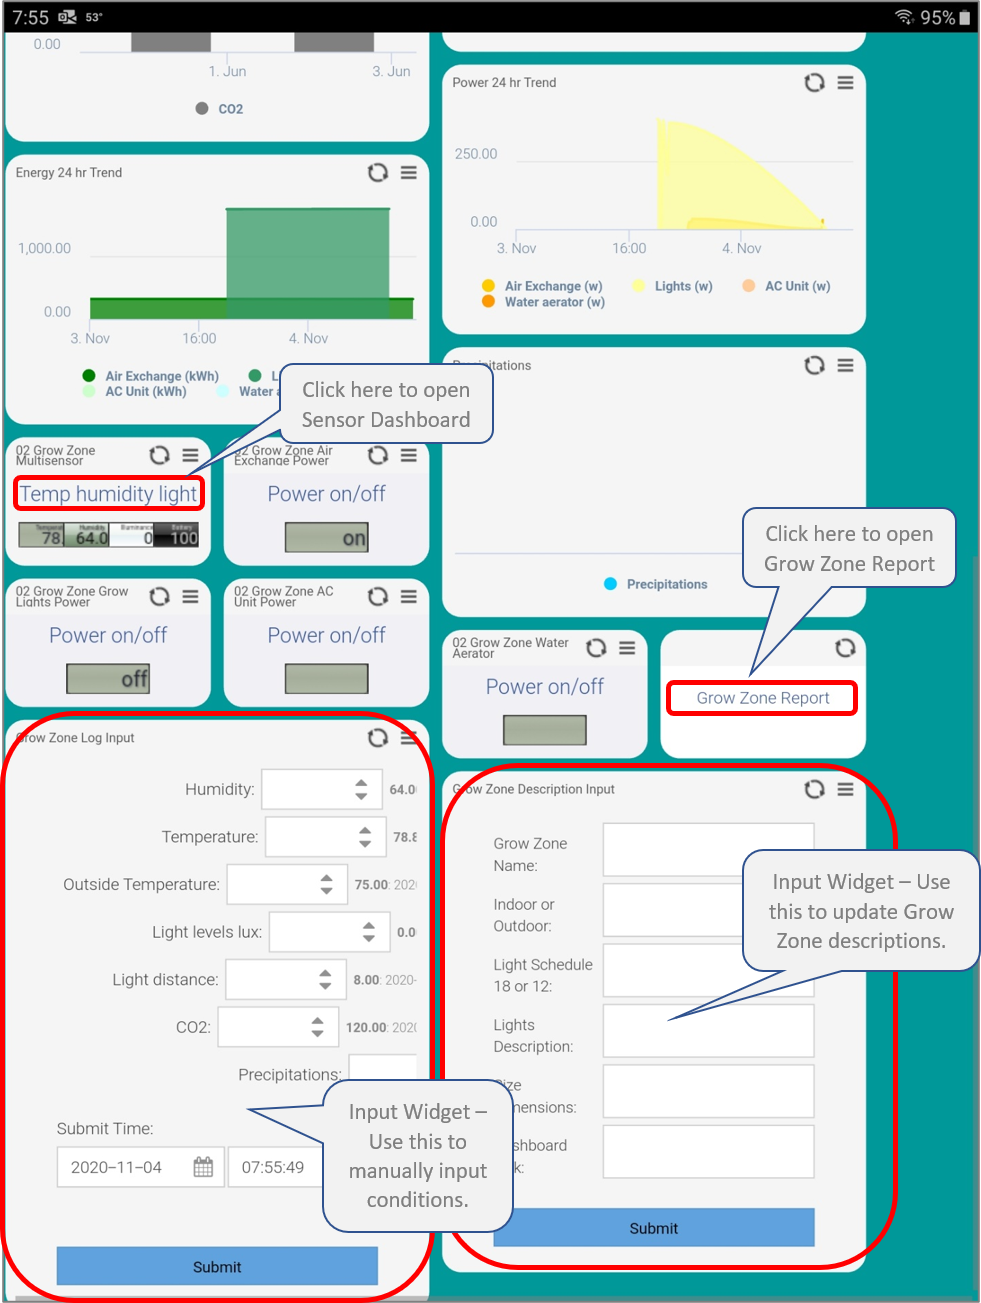
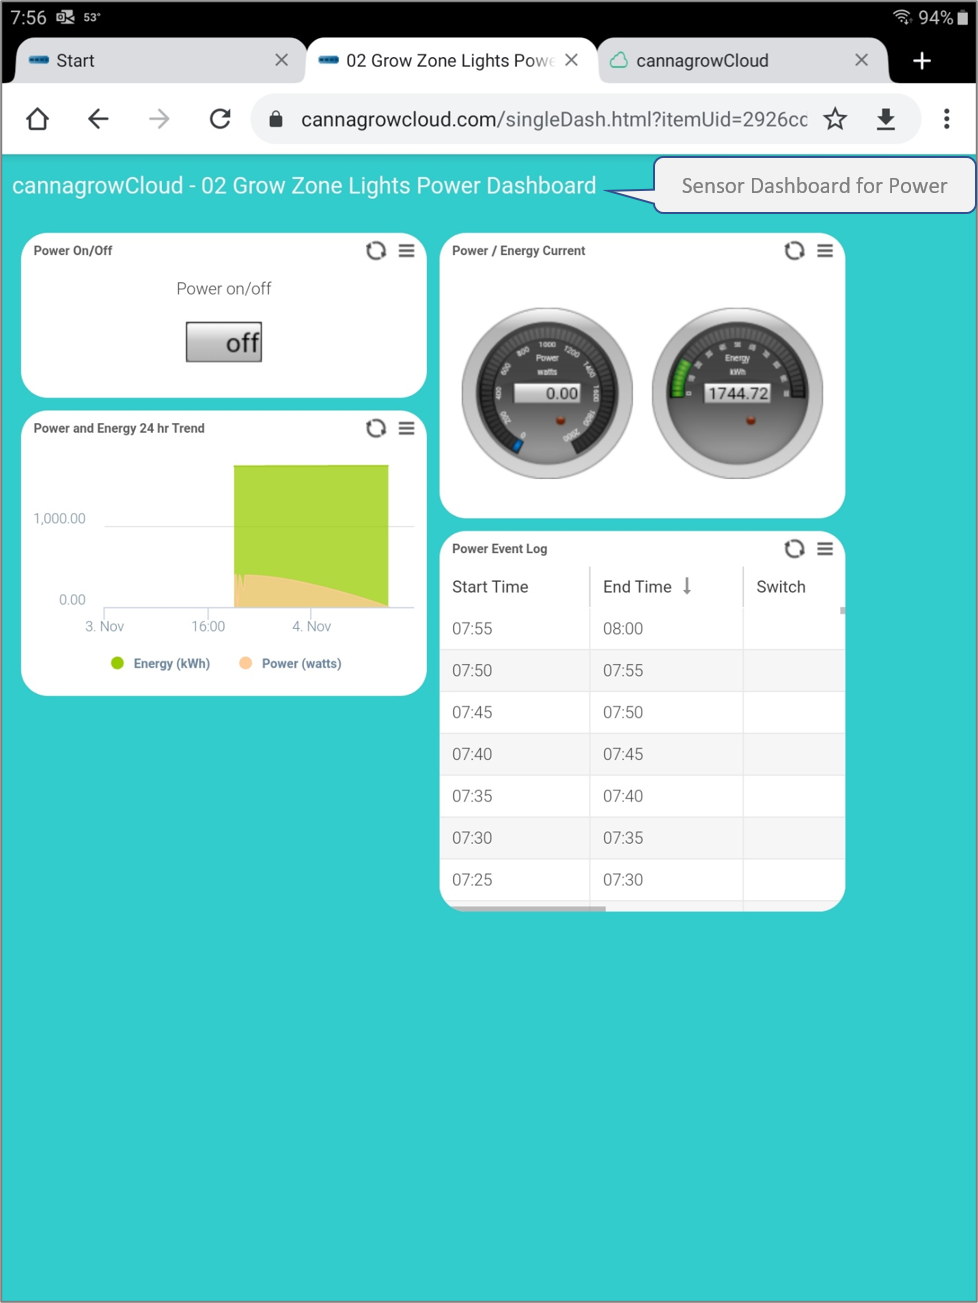
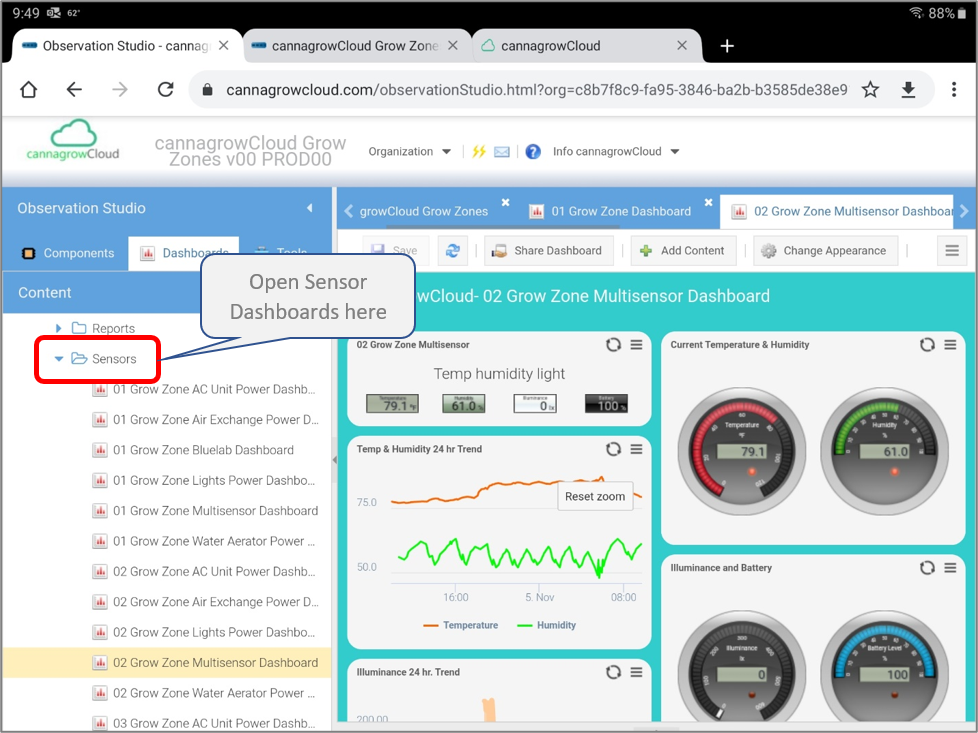
Links to Sensor Dashboards and Reports are found on sensor widgets.
Use the Grow Zone Log Input widget to manually enter conditions and readings and the Grow Zone Description Input widget to input descriptions of your Grow Zone.
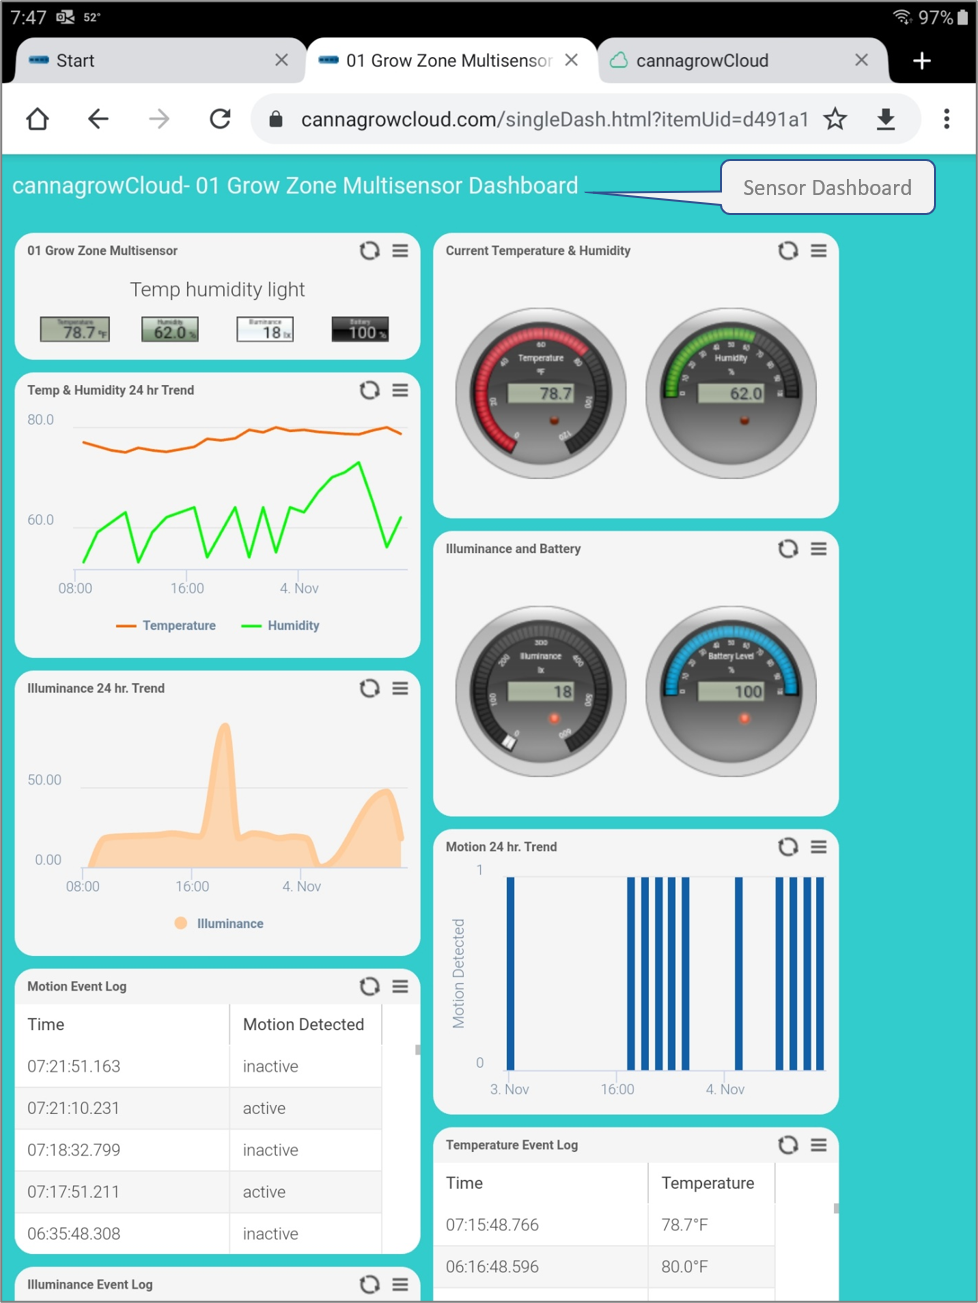
Sensor Dashboards provide currents and 24 hr. trendlines and detailed event logs showing all the data logged from a particular sensor.
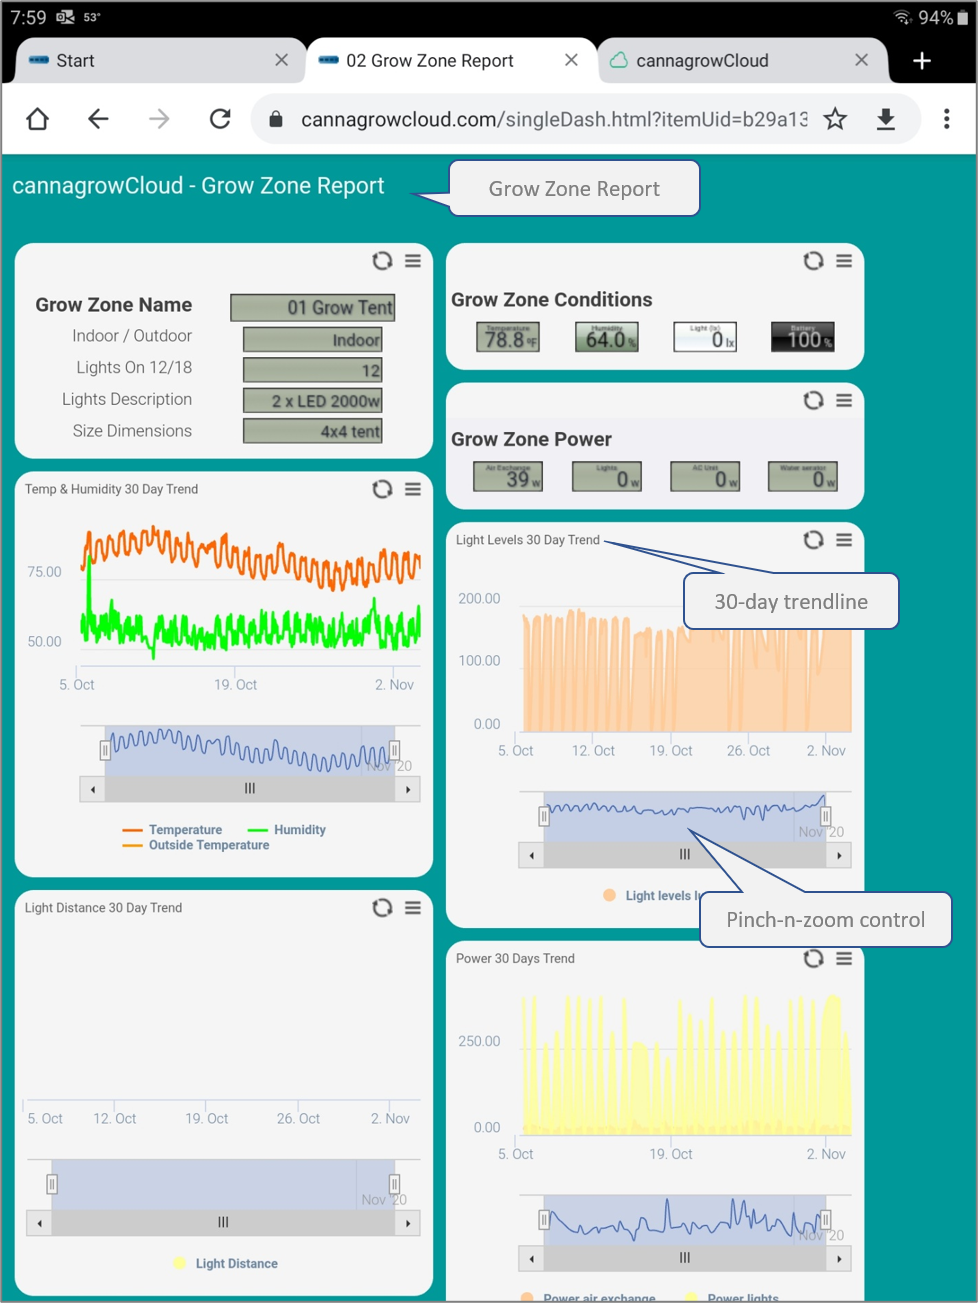
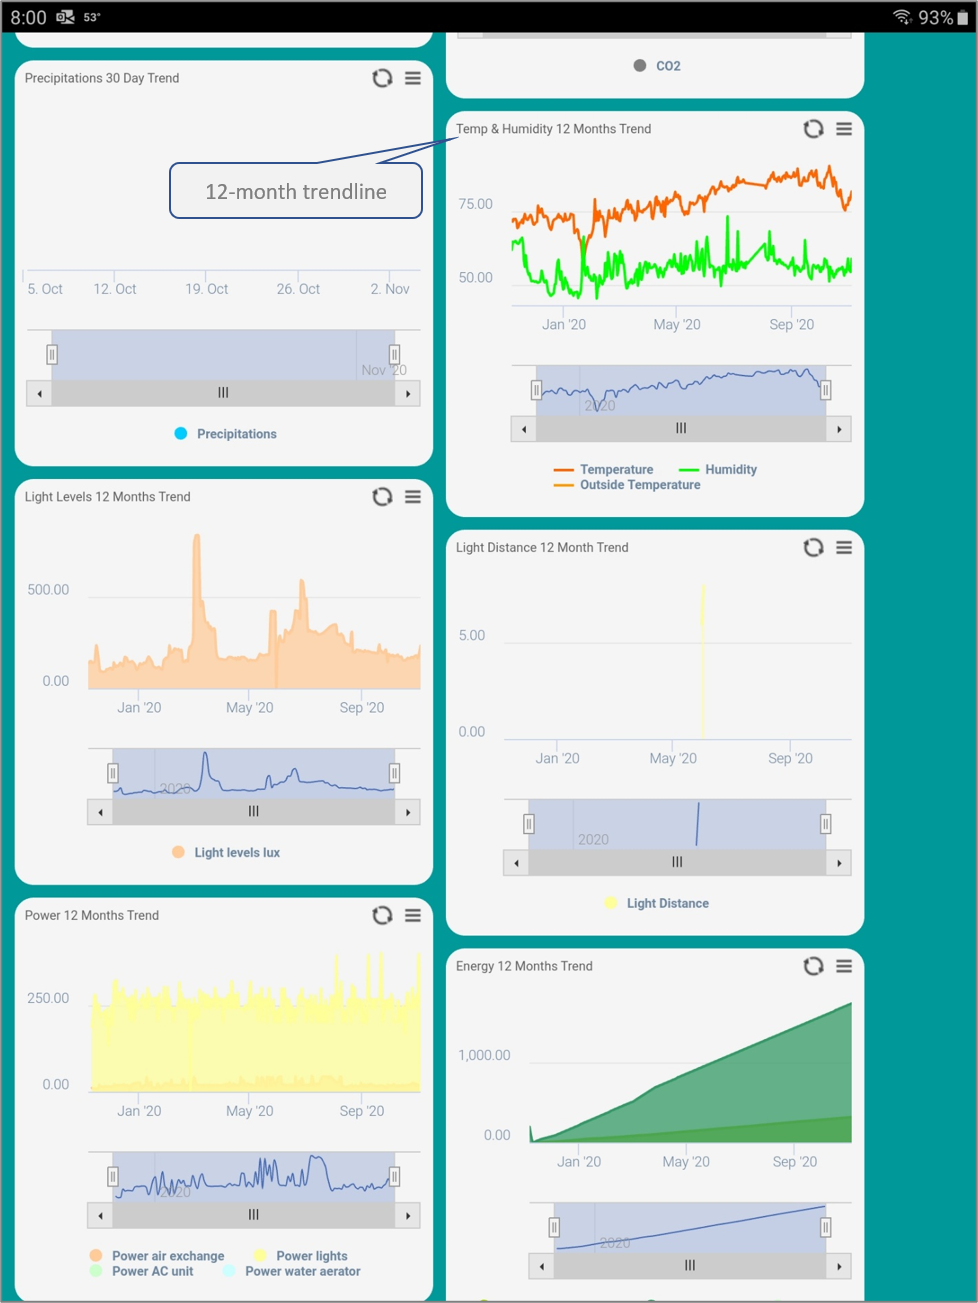
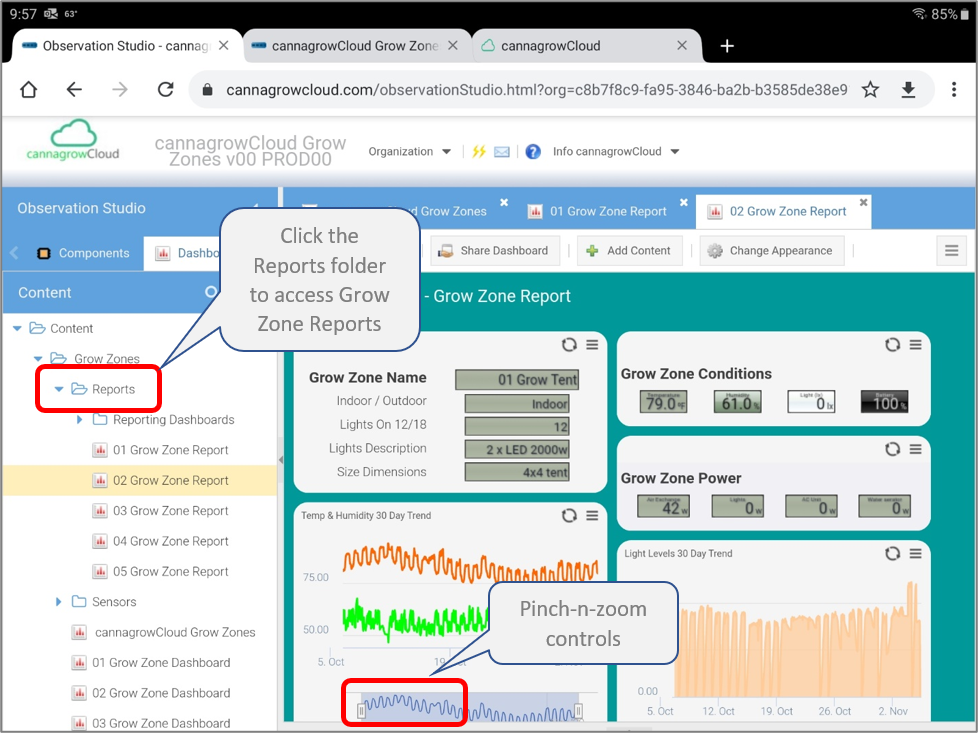
Grow Zones Reports provide current conditions, 30-day trendlines, and 12-month trendlines. The trendlines include pinch-n-zoom controls to expand specific time periods

Using Observation Studio
• Robust GUI
• Navigate dashboards
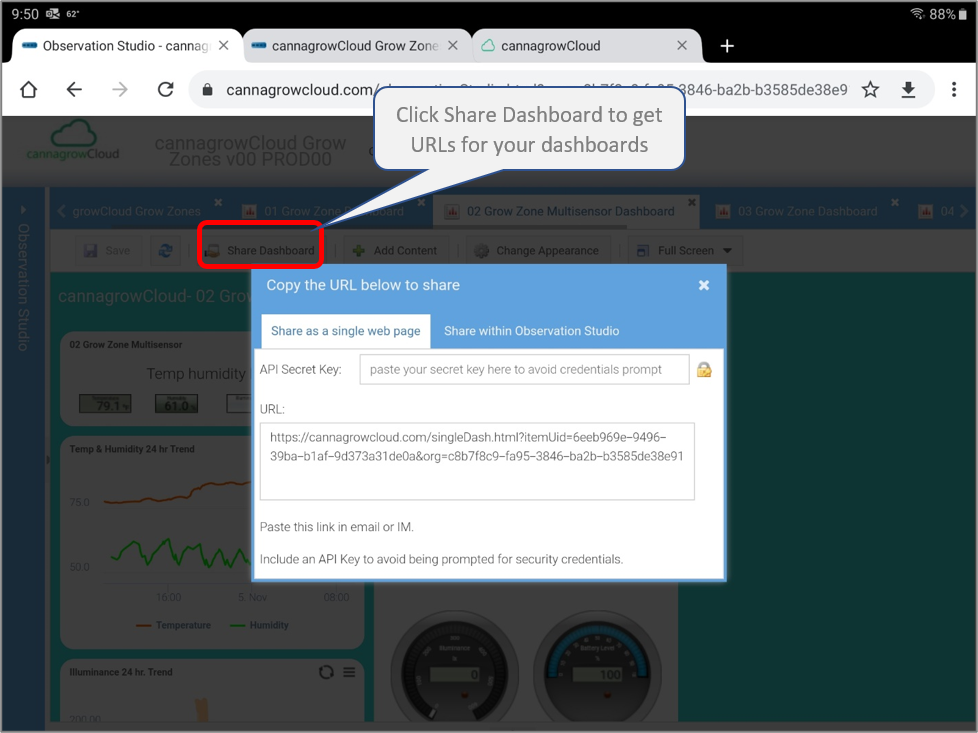
• Copy and share dashboard links
Use any browser to open Observation Studio.
Click on your organization name on the cannagrowCloud start page to open Observation Studio.
Observation Studio will open to your default Dashboard view, normally set to the cannagrowCloud Grow Zones overview dashboard.
Dashboards and folders for Sensors and Reports are listed along the left in a list view.
Dashboard data can be refreshed by clicking the dashboard data refresh control or on individual widgets using the widget data refresh control.
Collapse or resize the list view by clicking or dragging the resize control.
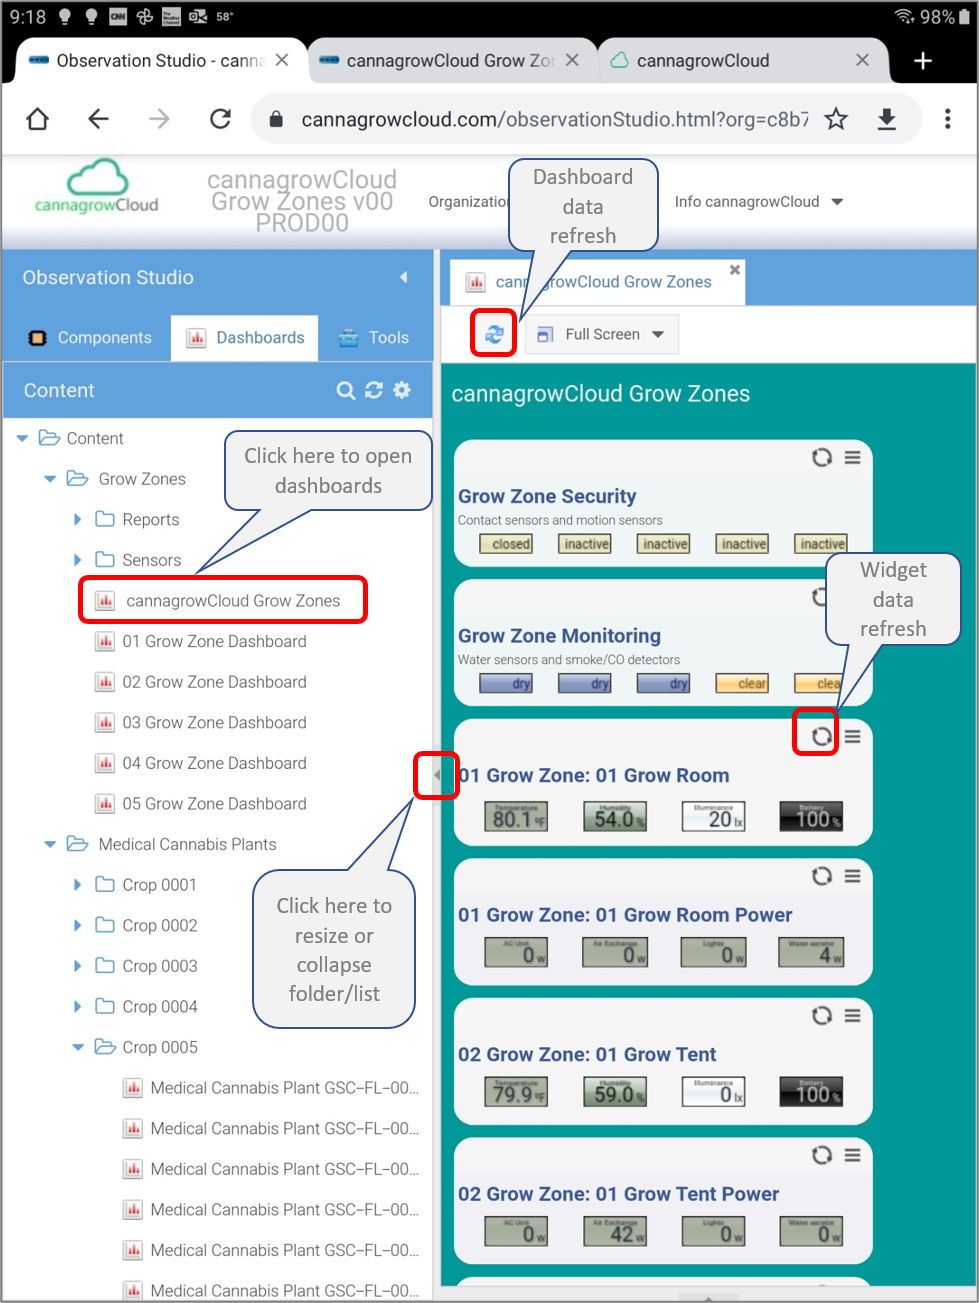
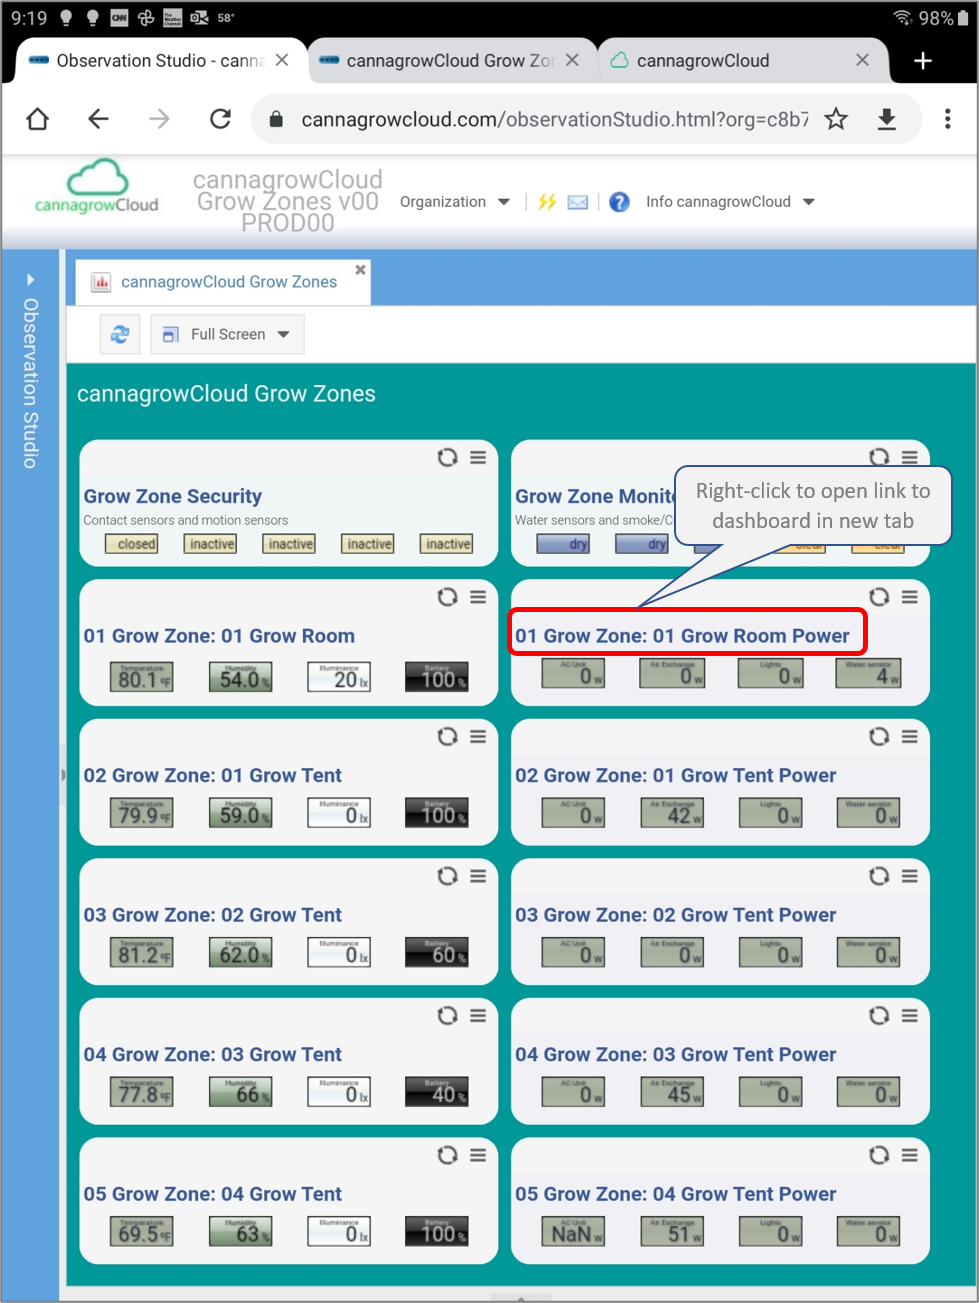
The following shows the dashboard list collapsed with more view area for the dashboard.
Right-click on the links on the overview widgets to open the dashboard in a new browser tab.
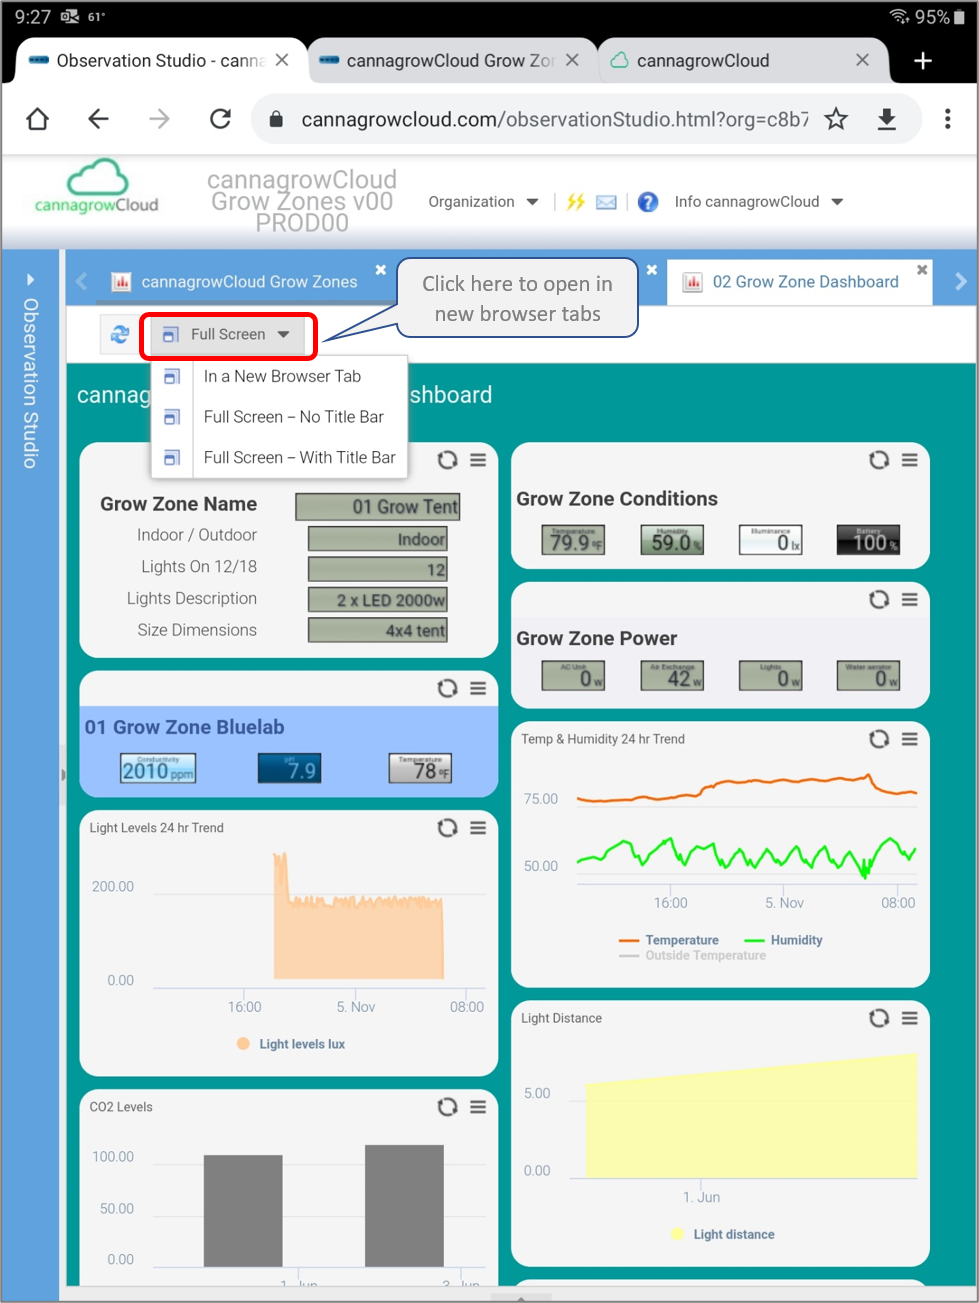
Click on the Full Screen control to open the dashboard in new browser windows or tabs.
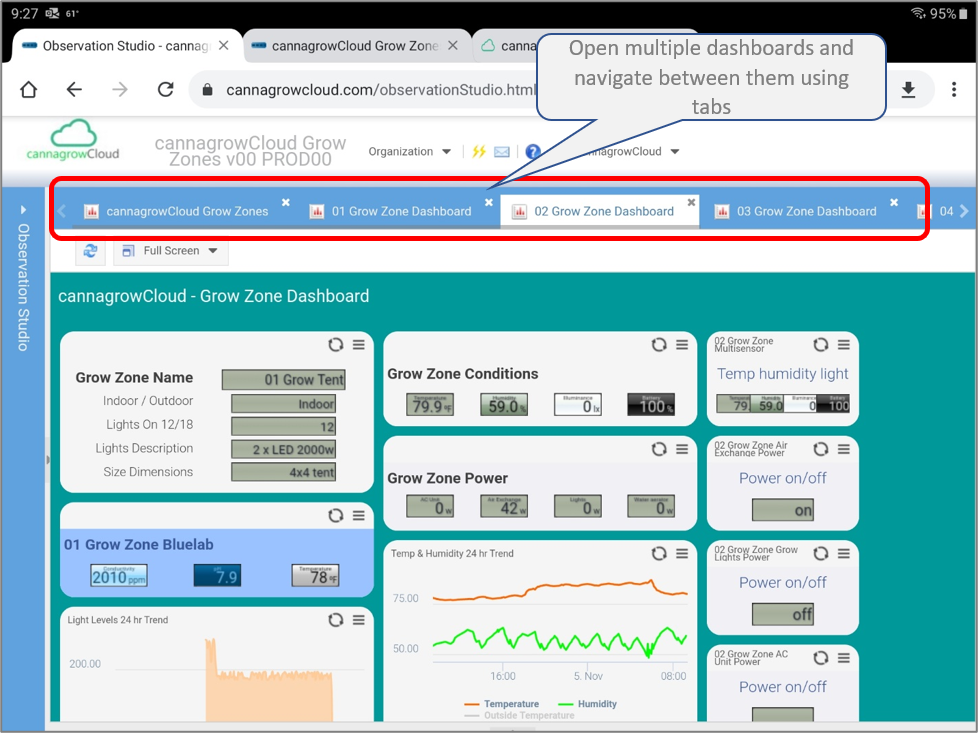
Open multiple dashboard views and navigate between them usings tabs.
Open the Sensors folder under the dashboard list to select individual sensor dashboards to view.
To access Grow Zone Reports open the Reports folder on the dashboard list.
To get the URL for a dashboard, click on the Share Dashboard control.
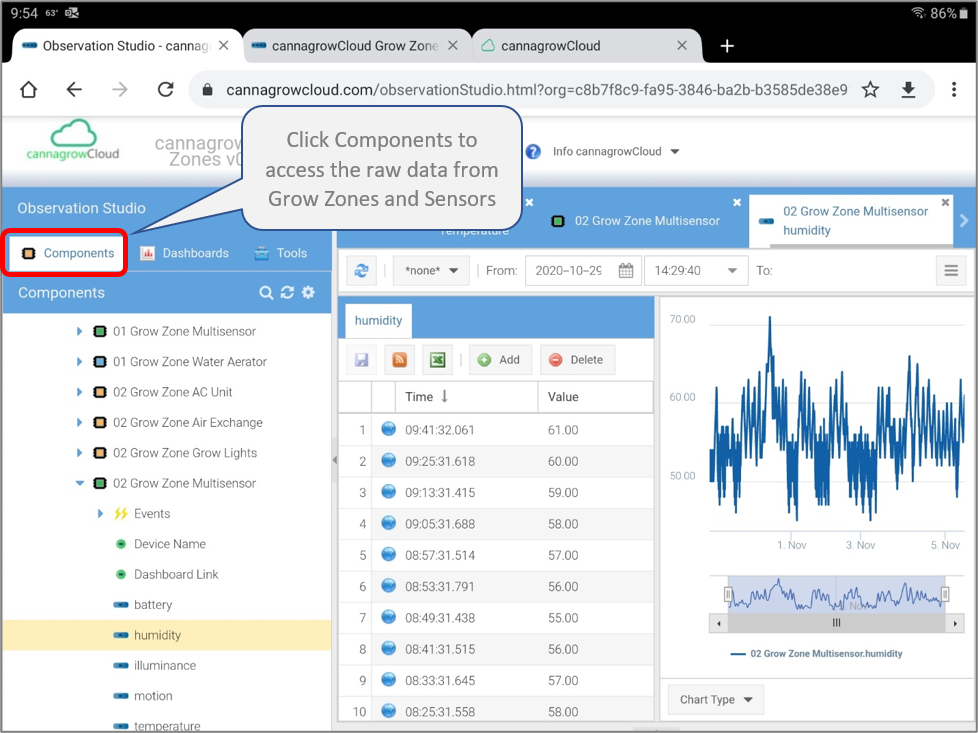
Select Components to access the raw data logged from individual sensors.
Be In The Grow...Always.
Questions? Contact us at info@cannagrowcloud.com.
#BeInTheGrow #BeInTheGrowAlways